 |
US 2020 Presidential Election PredictionsThis is the only site with all 2020 US Election Predictions
|
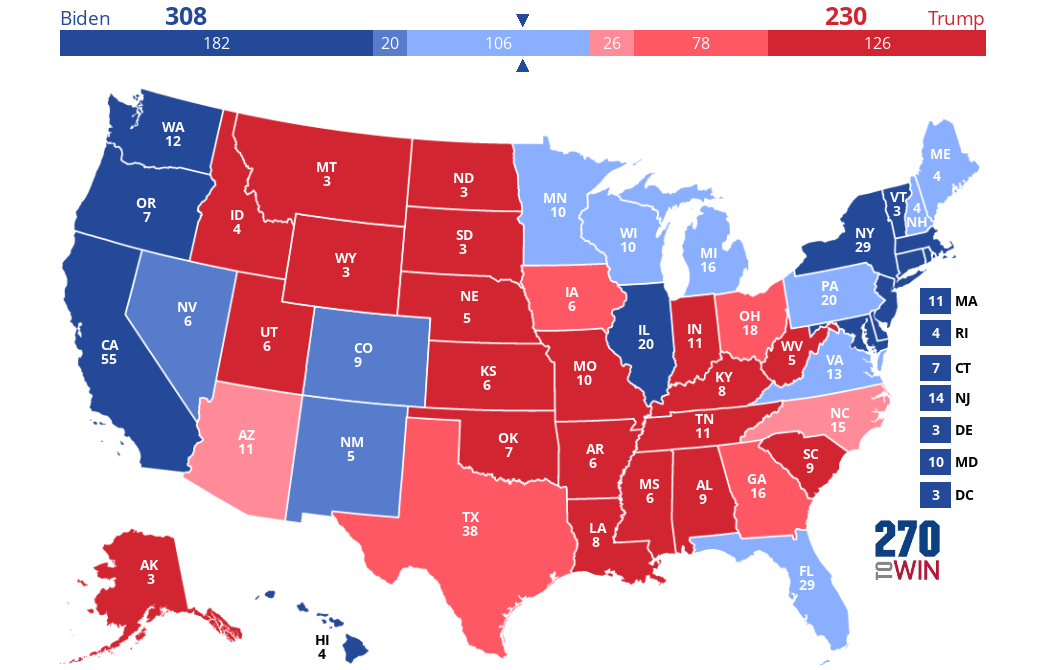
Moody's Models (updated Oct 24, 2020) General Description The outcome the public would like to know is just who will be the winner, a binary choice. Yet, this is not a good variable for error minimization. Dr. Fair's model and others models use the popular vote share for one party as the dependent variable. However a candidate can win the electoral vote and fail to win the popular vote. This happened five times in the 58 elections (Donald Trump, 2016, George Bush, 2000, John Benjamin Harris, 1888, Rutherford Hayes, 1876 and Quincy Adams, 1824) or in 5 of the last 58 elections. The model description is provided in the two links provided at the bottom. There are two releases of their model, September 2019 and July 2020. Moody's constructed 3 models, which are termed the "Pocketbook", "Stock Market" and "Unemployment Model." Each has slightly different set of variables, but the one variable in all 3 models is the real income per household, 2-yr, % change. Other variables are the US gas prices, nominal house prices - 2 year percent change, and the S & P 500 average - 1 year percent change and the unemployment rate, 2-quarters ppt change. -- Party Allegiance Factor:
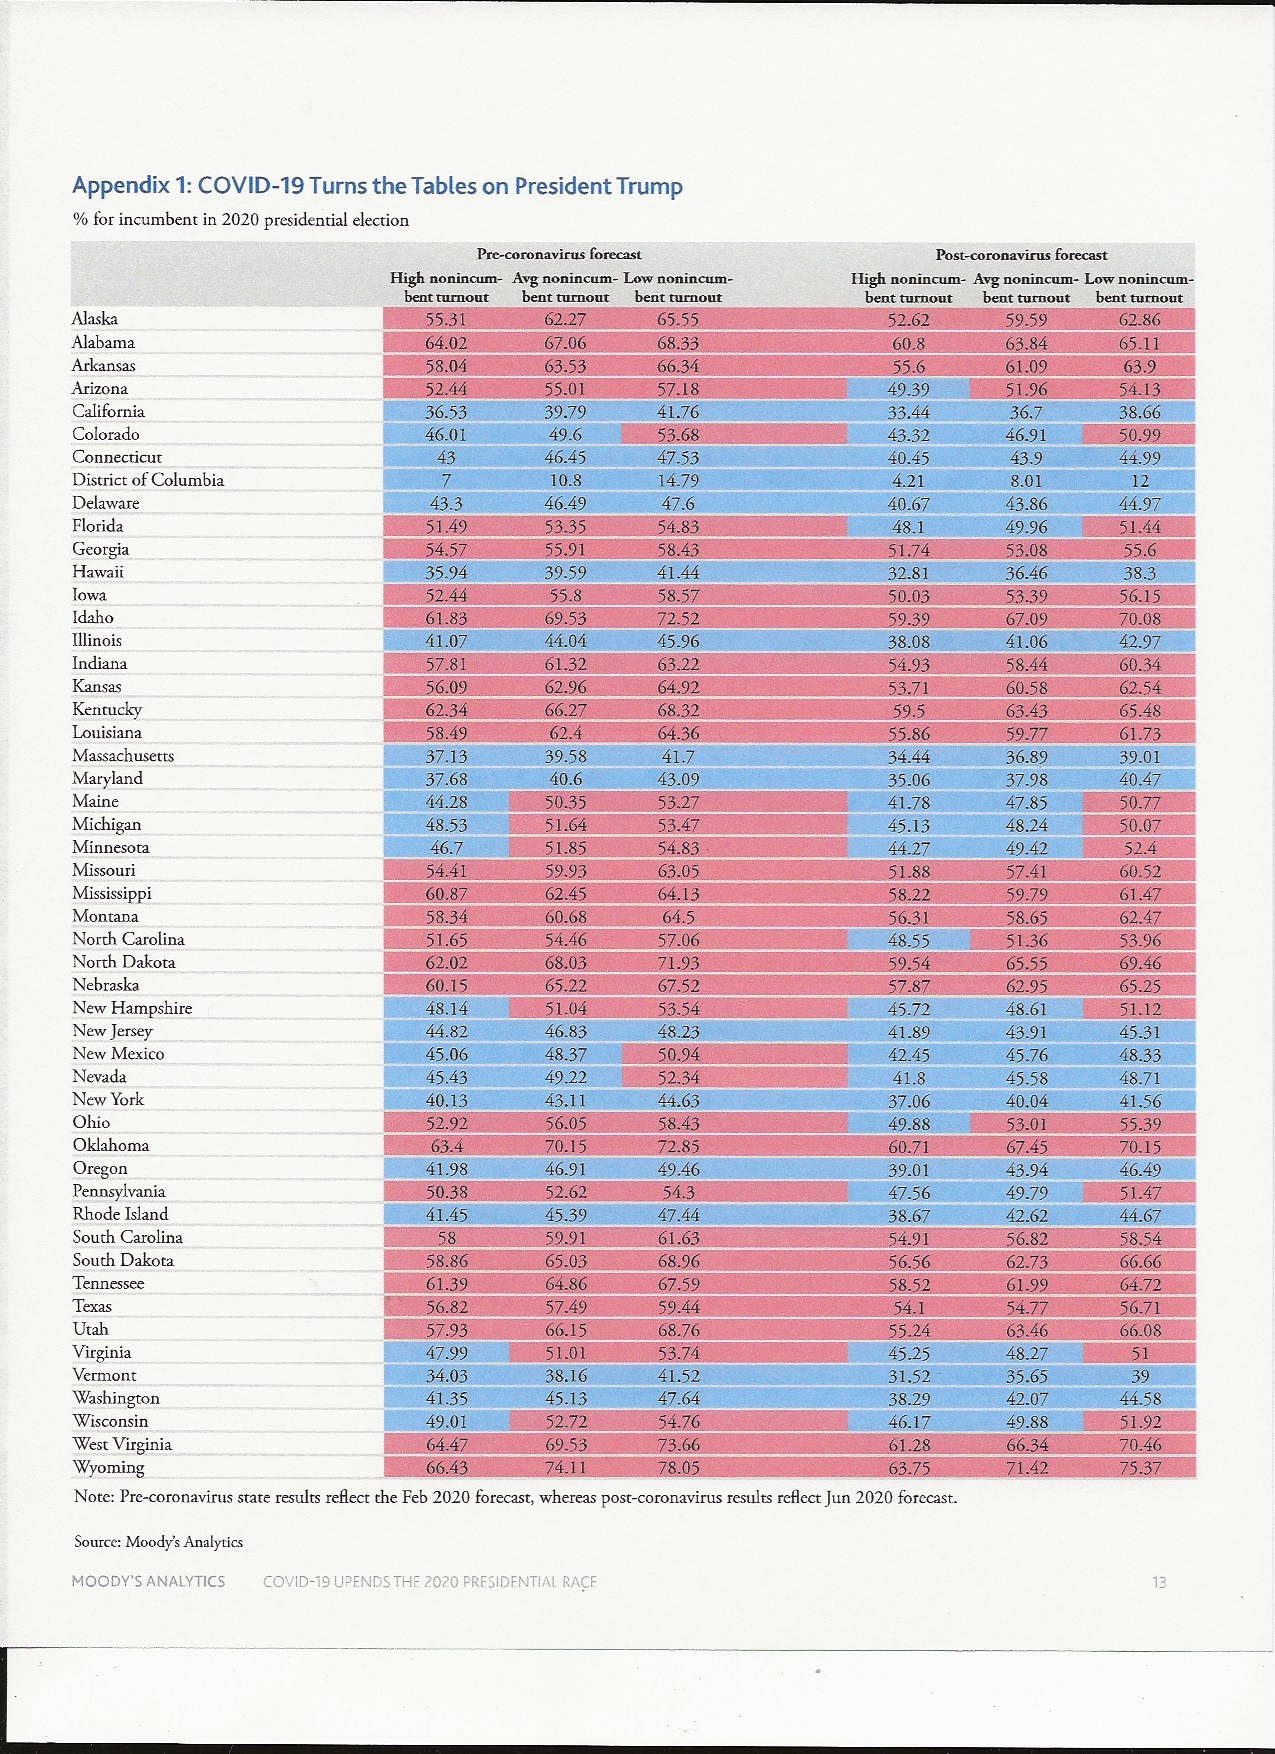
-- Approval Ratings: Approval ratings variable has an impact on the 2020 forecast. Moody's found the more meaningful variable is not the approval rating itself, but the change in approval rating while president. The change in Trump's approval rating has been much lower than other presidents, hence this variable did not detract much from the overall result (popular vote by state). The two other political variables (fatigue and democratic incumbent) were used to improve the model results in prior elections. The idea of highly similar voting patterns between elections is supported by Skyler Dale's work, as he found a median absolute change in voter share to be 3.7%. So, there is a very low probability that a state which which votes 60% for one party might be switch parties in the following election. He concludes, "We can typically get a good understanding of the states that will be close in the next general election by simply looking at the prior one." -- Other Variables: Variables to capture more subtle effects noted Moody's analyses, may not be meaningful in 2020 predictions, given the unique national focus on the coronavirus crisis. Moody's incorporates a "fatigue" variable, which represents the electorate's desire to change parties after two consecutive terms. It does not apply to 2020 election. The incumbent's party winning in the midterm election is considered a positive indicator variable. The Republicans lost control of the House, so this variable does not add to Trump's expected EV. Skyler Dale states, "There does appear to be a mild relationship between the two variables. Party performance in the congressional races is associated with performance in the general election. When added to the model, the feature provides modest but clear gains in predictive power." -- Results In their initial presentation, Moody's constructed 3 models, which are termed the "Pocketbook", "Stock Market" and "Unemployment Model." Each has slightly different set of variables, but the one variable in all 3 models is the real income per household, 2-yr, % change. Other variables are the US gas prices, nominal house prices - 2 year percent change, and the S & P 500 average - 1 year percent change and the unemployment rate, 2-quarters ppt change. As published in September 2019, each of these 3 models predicted a Trump victory, based on a state-by-state evaluation. The expected electoral votes based on the pocketbook, stock market and unemployment model was 351, 289 and 332 EV's. Similarly Moody's states "Under a moderate recession scenario, in which U.S. real GDP declines cumulatively by more than 2% over the next year, the average of our three models would point to a Democratic victory." Then came Covid-19. In July 2020, Moody's issued a revision to their forecast. They predict Joe Biden will win with 308 Electoral Votes. They now forecast Biden will win all the states that Clinton won in 2016, plus pick up Pennsylvania, Michigan, Wisconsin and Florida. Appendix 1 of the white paper provides the percent of the vote Trump would win in each state. I have reproduced their map, adding categories of lean when the voting margins are within 5% and likely when voting margins are within 10%. Also, their table of results is included. The white paper focuses on three key states: Pennsylvania, Michigan and Wisconsin, which they predict Trump's popular vote would be 49.79%, 48.14% and 49.88%, so they all could easily go to Trump. In fact, this is exactly what happens in their second sensitivity case, where they assume high Republican turnout on election. Further they state, "The polls were notoriously wrong in these battleground states during 2016 because of sampling issues that underrepresented white voters without a college education." Further, the analysis suggests that "the pandemic could disproportionally scare Democratic voters away from the ballot box, especially in urban areas where high population densities exacerbate viral transmission." It could be some Republicans were accepting this idea. Moody presented two sensivity cases. In the first case, Democrat voter turnout is assumed to be high and Biden wins 352 electoral votes. In the second c ase, Republican turnout assumed to be high, and Trump wins the election with 345 electoral votes. Since these are more in the category of "What if's", I decided not to include these cases in the average of all models. David Lord Moody's Forecast July 2020 ModelLikely states = States with predicted voting margins < 10% , Lean states = State with voting margins < 5%
Links: Covid-19 Upends Presidential Race (July 14, 2020, Presentation slides) July 2020: Who will be the next President
|

 Click the map to create your own at